"What gets measured, gets managed." In DevOps, DORA metrics — deployment frequency and lead times — signal high performance. But beware Goodhart's Law: when a measure turns into a target, it quickly loses value.
If you tell a team they are judged solely on how many times they deploy, they will find a way to ship 10 tiny, meaningless updates a day just to hit the number. Your metrics go up, but your actual value stays flat, and your team starts to burn out. Instead, encourage healthy deployment practices: aim for frequent, meaningful releases that are tied to actual customer value; ensure each deployment meets quality and security standards; and celebrate improvements in both velocity and outcomes, not just raw numbers. This way, the team focuses on delivering real impact while working at a sustainable pace.
The Balancing Act
To move fast without breaking your culture, you have to balance your Performance (DORA) with Human Telemetry (Health). Human Telemetry refers to the practice of systematically tracking signals of your team's wellbeing, such as engagement survey results, burnout reports, retention rates, and even team sentiment during retrospectives.
To get started, try running a monthly engagement pulse survey using tools like Officevibe or TinyPulse; send out a short, anonymous well-being check-in through Slack or email every couple of weeks; and review retention or absence trends quarterly. Also, make it a habit to include a quick, one-question burnout check at the end of each retrospective. By measuring both engineering performance and human experience, you can spot problems early and sustain a healthy balance.
Think of it as a seesaw:
| The DORA Metric | The Health Counter-Metric | Why it Matters |
|---|---|---|
| Deployment Frequency | Meaningful Work Score | Shipping fast is only "high performance" if the team feels the work actually matters. |
| Lead Time for Changes | Cognitive Load | If speed is increasing but the code is becoming "impossible to understand," you're redlining the engine. |
| Change Failure Rate | Psychological Safety | If failures drop to zero, your team might just be too scared to innovate. You need a "blameless" culture to stay fast. |
How to Avoid the Trap
For busy leaders, the strategy is simple: Use DORA to find bottlenecks, not to rank people.
For example, suppose a leader notices the team's deployment frequency has dropped over the last month. Rather than using this metric to single out individual engineers, the leader brings the team together to discuss any obstacles. Through this discussion, they discover that a new manual QA step has slowed down the release process. Together, the team looks for ways to automate that step, improving efficiency free of blame.
- Metrics are a Compass, not a GPS: They tell you which direction to look, but they don't tell you the whole story.
- Measure the "Cost of Speed": If your DORA stats look elite but your attrition rate is rising, you aren't efficient — you're just exhausting your most valuable assets.
- The "Why" Matters: Always pair quantitative data (the what) with qualitative feedback (the how it feels). To put this into practice, use regular retrospectives or brief pulse surveys to collect honest input from the team. Even informal check-ins and anonymous feedback forms can give valuable context to the numbers.
The Bottom Line
High performance isn't just about shipping code at 100mph. It's about building a system that makes shipping easy, safe, and sustainable. If you optimize for the numbers and forget the humans, Goodhart's Law will eventually collect its debt. To keep this balance in check, make regular review part of your routine: set a recurring time to revisit both your technical metrics and your team's health data. As your team grows or priorities shift, use these feedback loops to adjust targets, address warning signs early, and keep sustainable delivery at the heart of your process.
The goal isn't a perfect dashboard; it's a healthy, high-velocity team.
Measuring DORA in Nervespan — Without the Goodhart Trap
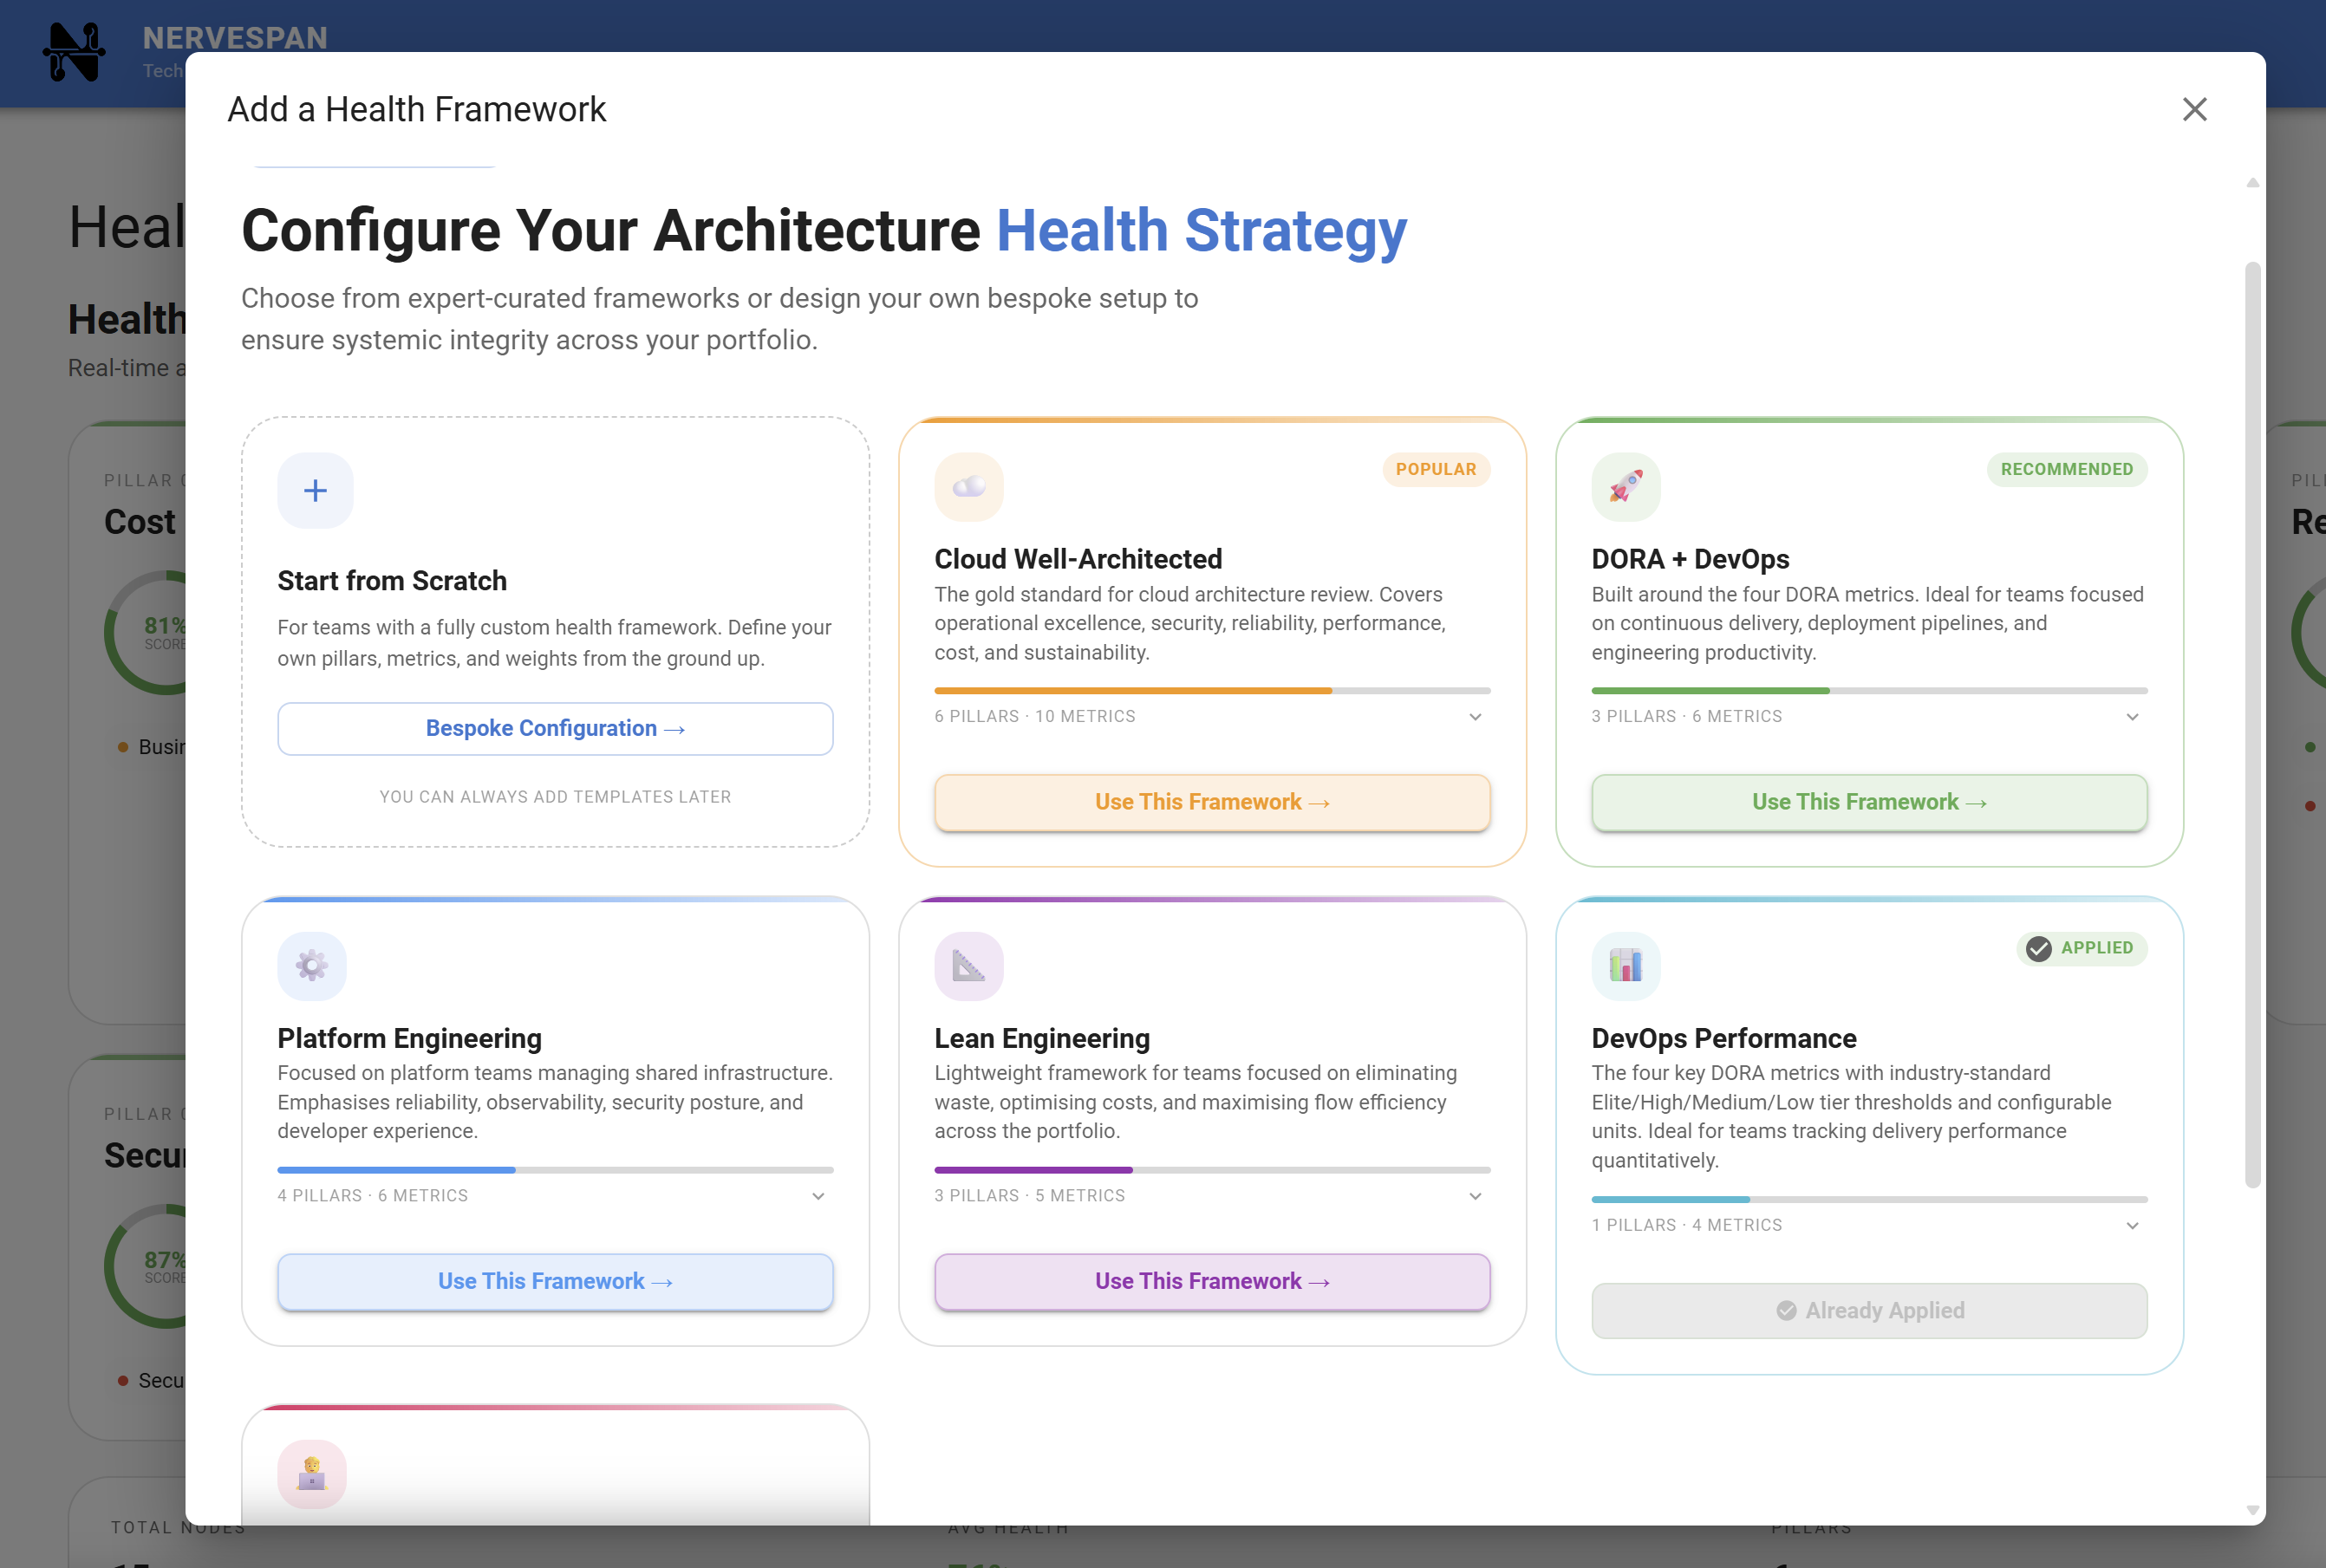
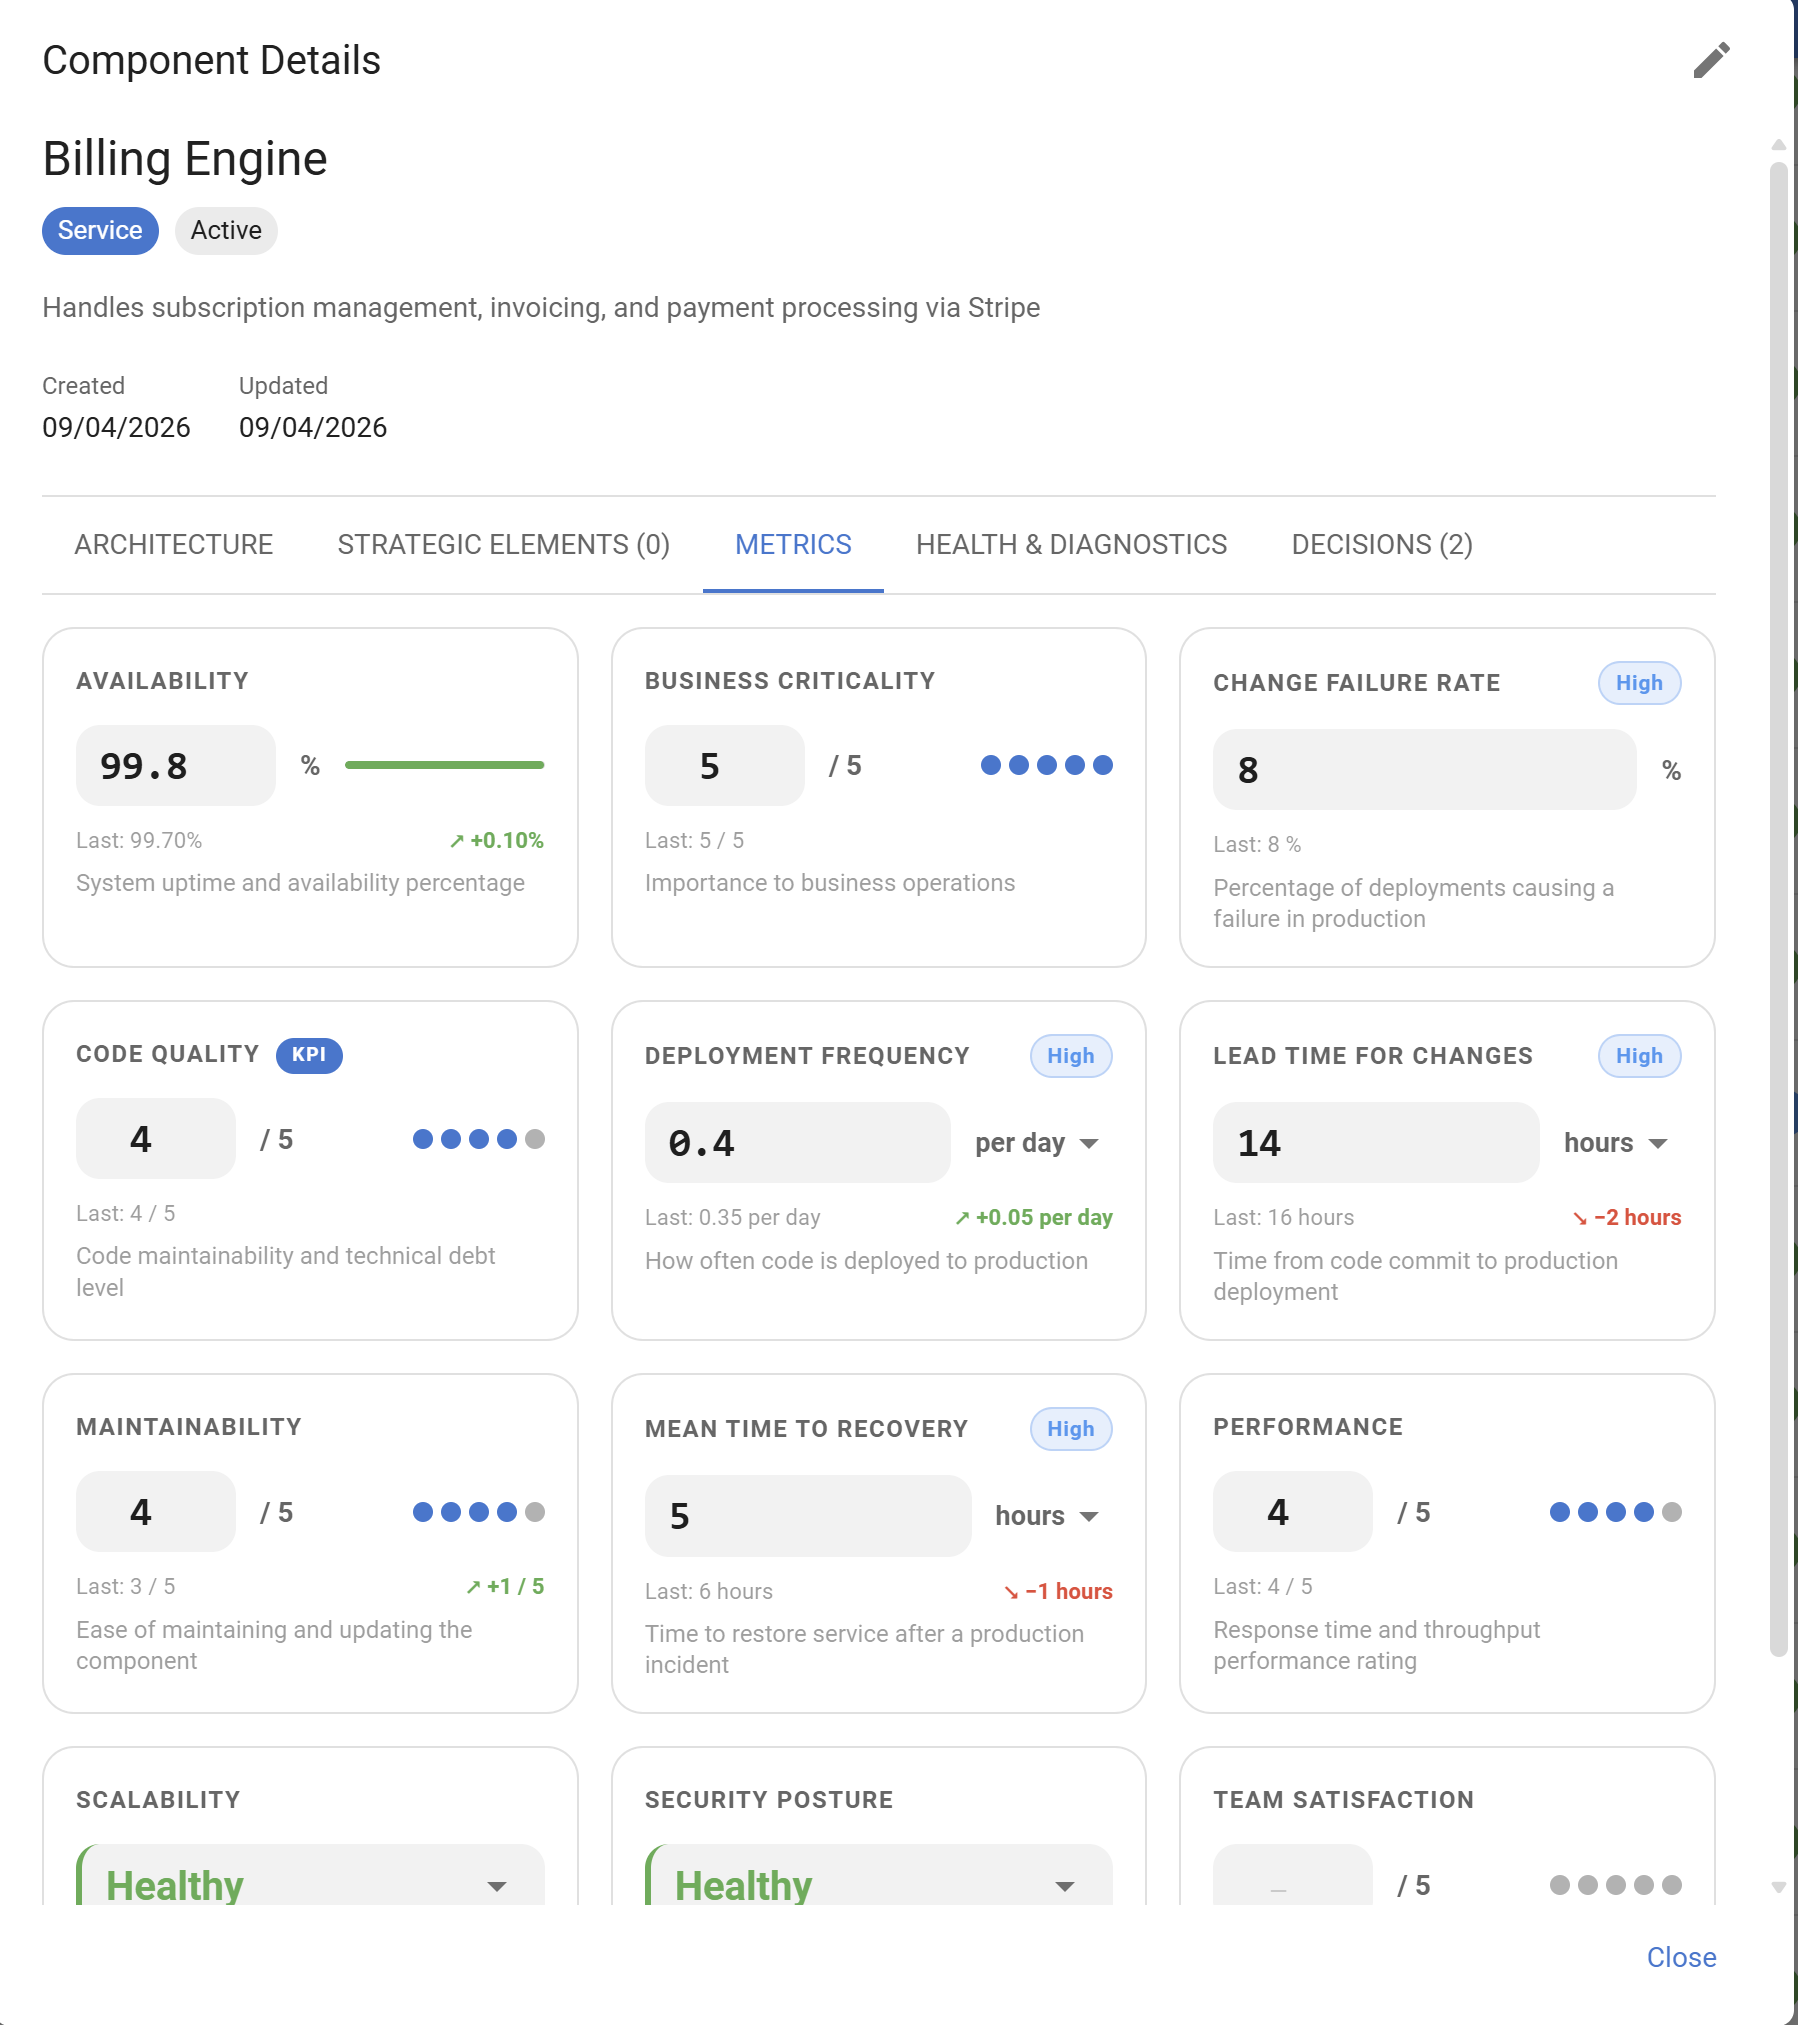
This is exactly the kind of balance Nervespan is built for. Rather than giving you a single number to chase, Nervespan lets you track all four DORA metrics — Deployment Frequency, Lead Time for Changes, Change Failure Rate, and Mean Time to Recovery — with built-in, industry-standard tier thresholds (Elite, High, Medium, Low) so you can see where you stand without turning the numbers into a leaderboard.
What makes this different from a spreadsheet or a standalone DORA dashboard is context. In Nervespan, DORA metrics live alongside your component health scores, your technology lifecycle data, and your strategic elements. So when your Lead Time for Changes creeps from Elite into High, you can immediately see whether it correlates with a component that's carrying technical debt, a technology approaching end-of-life, or a team that's been stretched across too many initiatives.
Nervespan's Health Setup Wizard includes a pre-packaged DORA + DevOps bundle that configures all four metrics with the right thresholds and units out of the box — no manual setup, no guessing at what "good" looks like. For teams that want to go deeper, there's also a DevOps Performance bundle with configurable units (hours, days, weeks; deploys per day, per week, per month) so you can measure in whatever cadence makes sense for your delivery rhythm.
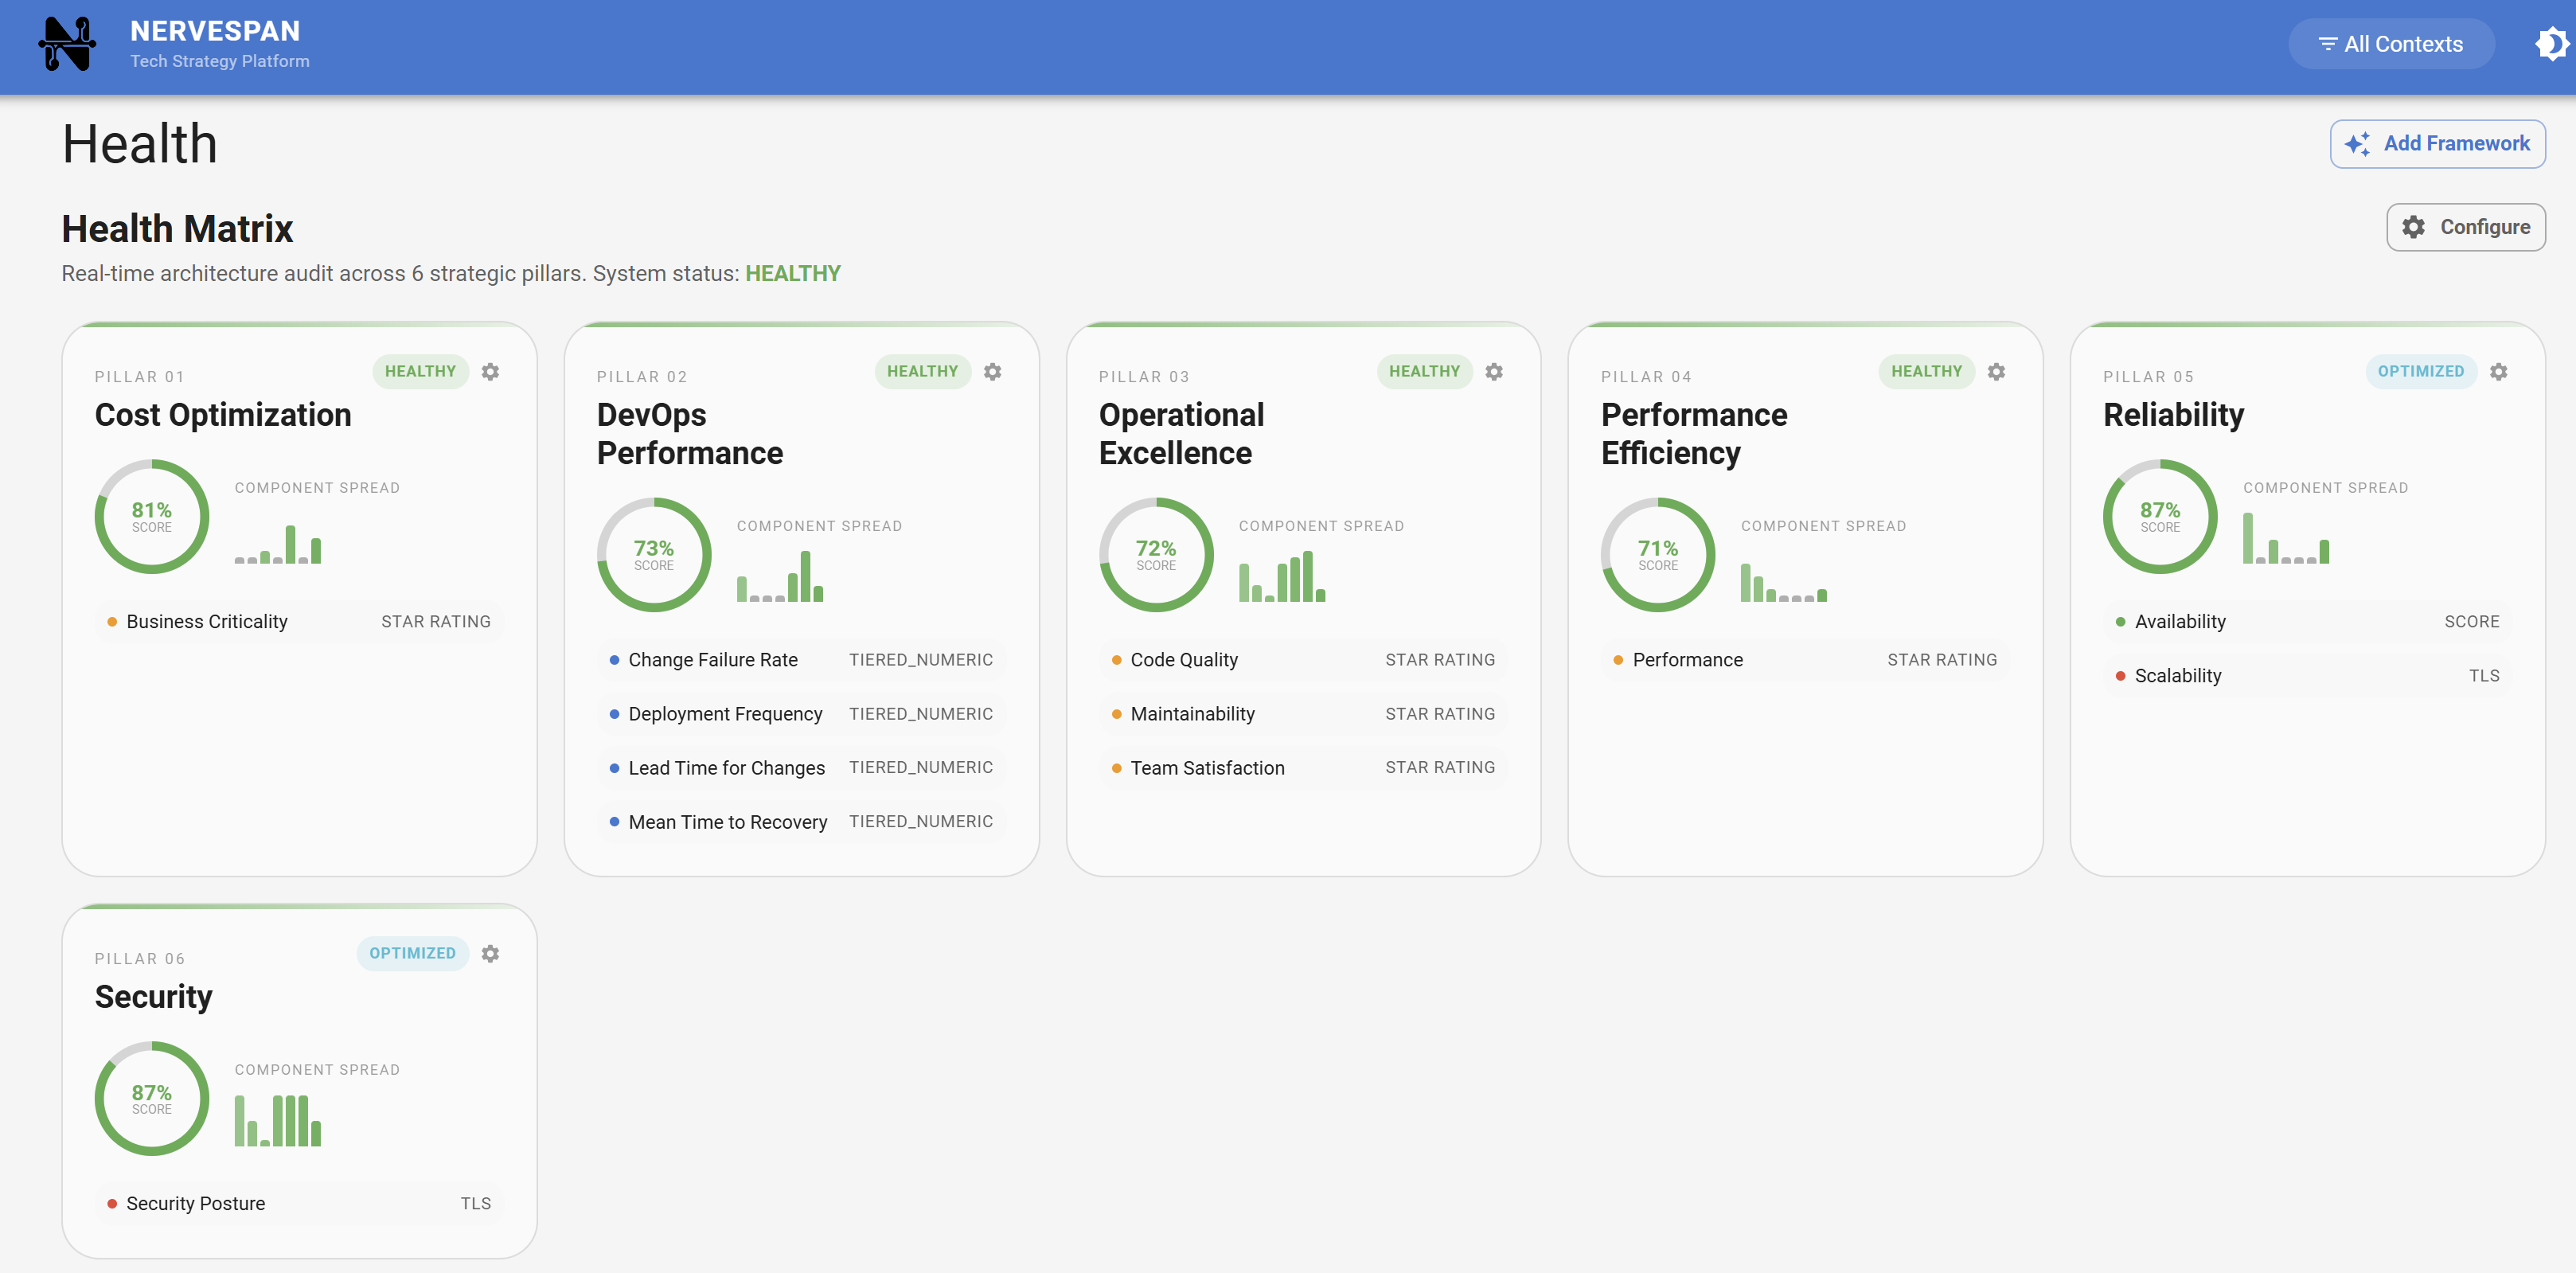
Crucially, DORA metrics in Nervespan feed into your composite health score alongside other pillars, such as code quality, security posture, and operational readiness. This means you can't game one metric in isolation without it showing up as an imbalance elsewhere. If your deployment frequency is elite but your change failure rate is climbing, the composite score reflects that tension. If your lead times are shrinking but your team's satisfaction scores (tracked via SPACE dimensions) are dropping, that signal is visible too.
The result is a system that encourages the behavior this article advocates: use DORA to identify bottlenecks, pair it with human and qualitative signals, and keep the priority on sustainable, meaningful delivery — not just impressive numbers on a slide.
Ready to make your technology strategy operational?
nervespan helps CTOs and architects plan, manage, and communicate technology strategy with confidence.
Start Free Trial